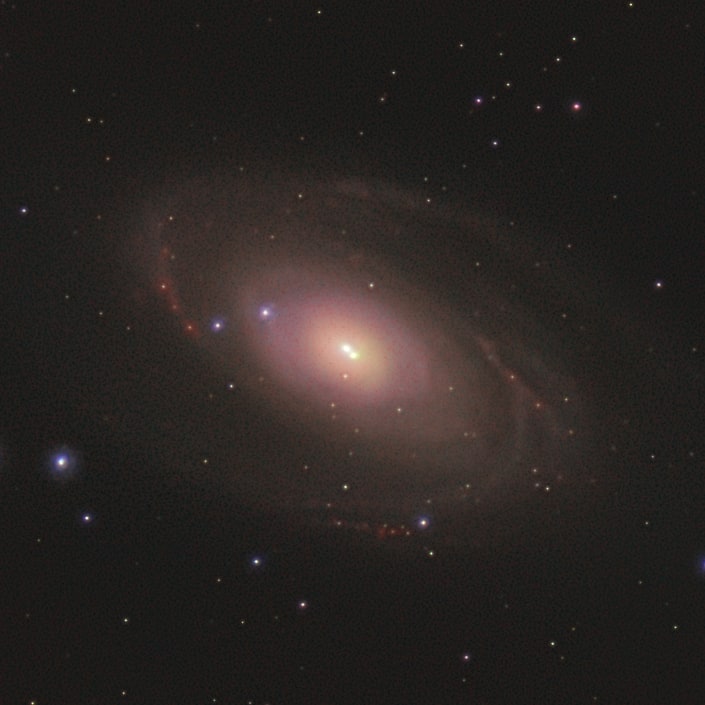
M81
Bode's Galaxy
- Rows
- 51
- Subs
- 5,282
- Loss
- 19%
- Alt
- 50.8 deg
 AstroGuide:Portfolio Chris Hollander’s Astrophotography
 AstroGuide destinations
Community Research
A research page evaluating whether target geometry, tracking drift, capture settings, observation age, and local conditions help explain dropped frames. The analysis combines historic observations for the study targets with the June 15 controlled four-target run.
Research subjects
M81
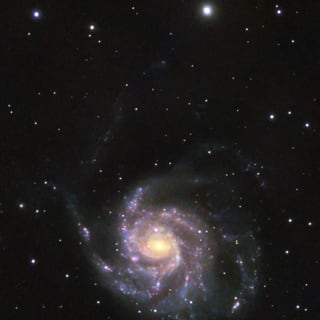
M101
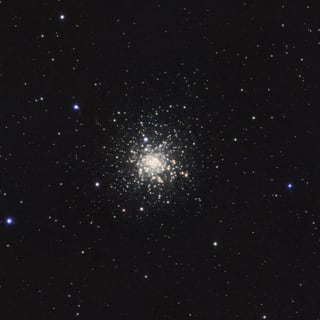
M12
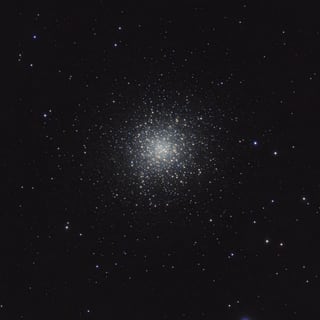
M13
Additional historic subjects
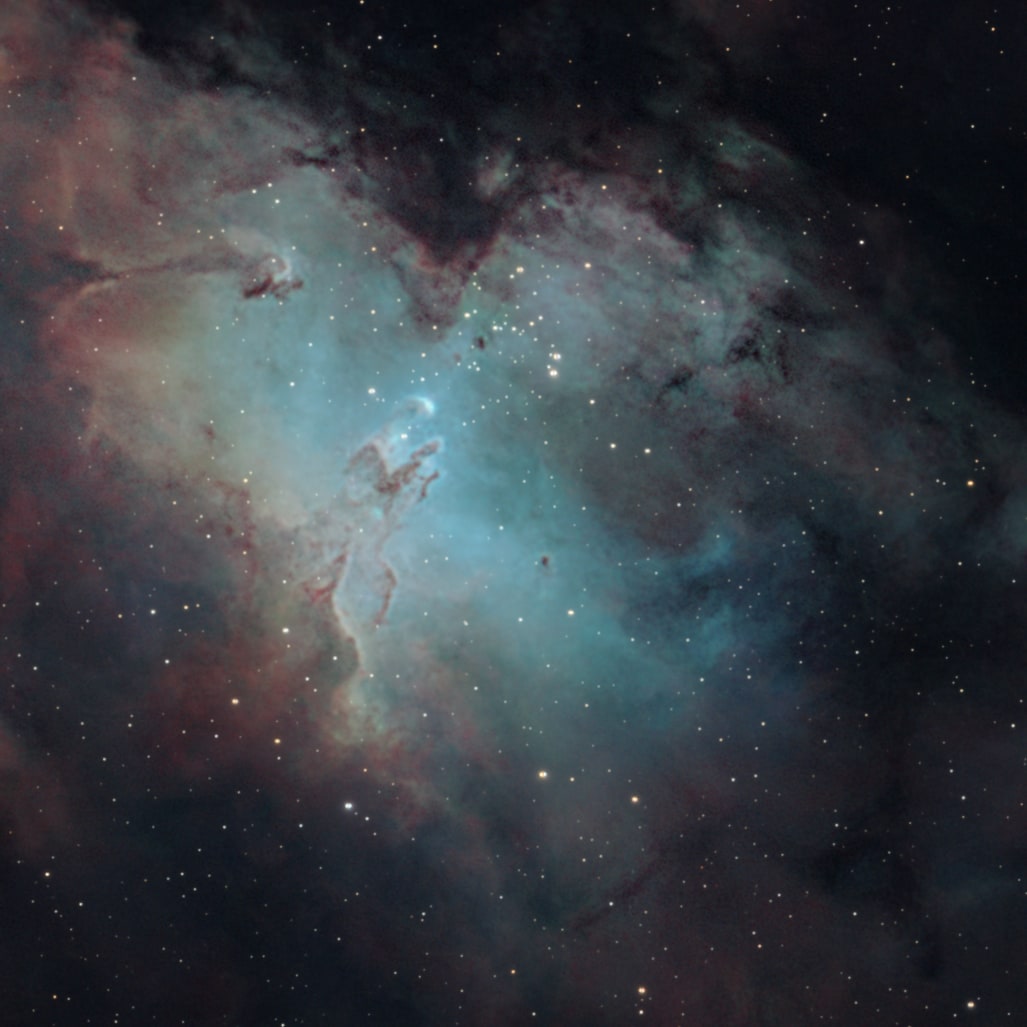
M16
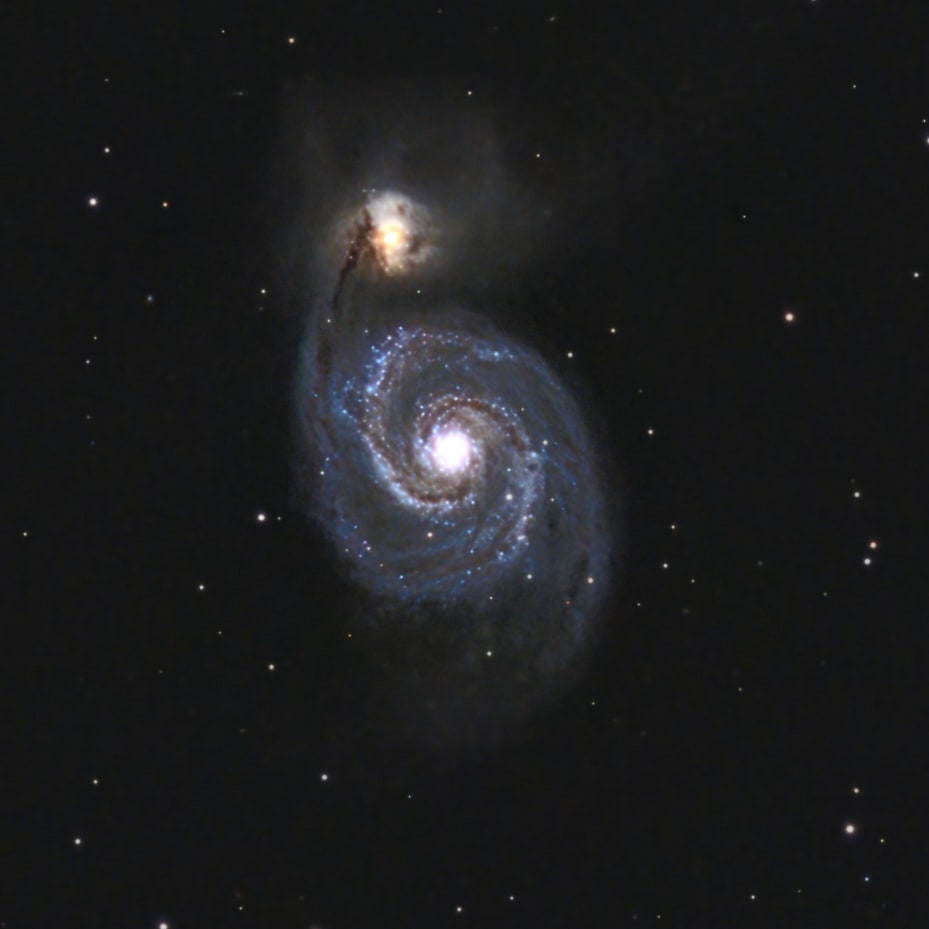
M51
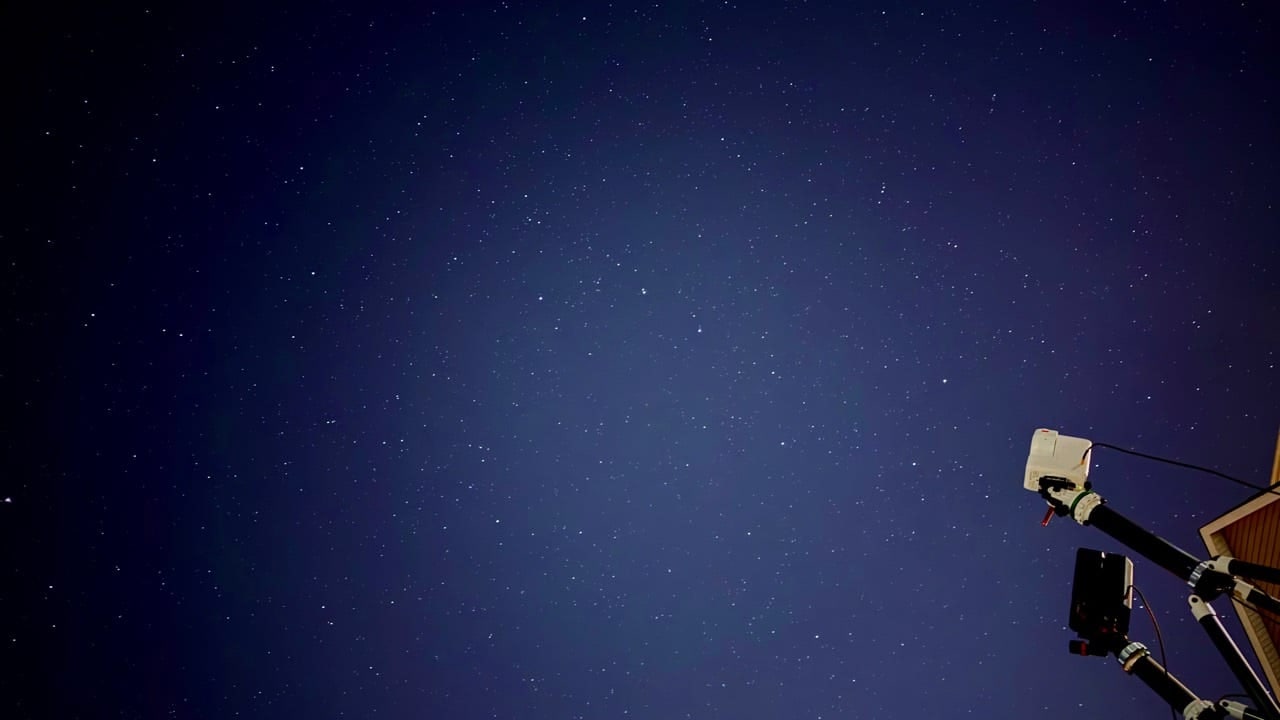
Capture site
The longitudinal slice holds the sky, gear, and observer mostly constant while setup rigor, polar alignment, and stability practice changed over time.
Community survey
In his project video, Curtis from Astronomy Tips & Reviews asks Seestar owners to help measure how much performance varies from unit to unit, especially in frame acceptance rates that affect final image signal-to-noise and star quality. His controlled protocol asks participants to use stable EQ setups, current firmware, 30-second exposures, good polar alignment, and a shared target sequence of M81 or NGC 6503, M101, M13, and M12 for comparing rejected-frame behavior while reducing setup, weather, and target-choice noise.
Related research
A LONGITUDINAL (NOT LATITUDINAL 🙃) ANALYSIS OF SEESTAR PRACTICE OVER TIME.
Unlike Curtis's broader community survey, this is a longitudinal rather than latitudinal analysis: it follows one observer's practice over time instead of comparing many observers across locations. It publishes historic observations of the same target set, uses AstroGuide-derived fields to explore dropped-frame and SNR signals, and keeps observation age in the models as a control for firmware, tripod stability, and improving polar-alignment practice.
Results from historic analysis
The historic slice covers 126 observations and 117.9 hours of integration, with a median elapsed-loss proxy of 23%. The strongest early signals are not altitude alone: the device split, modeled sky brightness, elapsed session length, wind gust, and end altitude all carry weight in the current screens. Because these rows were not collected under a single controlled protocol, the results are best read as a hypothesis map for the controlled survey data rather than as a definitive conclusion.
Observation age is also part of the result, not just a nuisance variable. Older sessions show substantially more loss in a simple longitudinal trend, which is consistent with improving polar alignment, tripod stability, firmware maturity, and a less casual approach to setup as the season went on.
Protocol
The community protocol asks contributors to run one night, four targets, and one hour per target. This page separates the June 15 controlled run from the historic context, where elapsed windows, target choice, and weather coverage were not collected under a single protocol.
The predictor screen controls for observation age, so older polar-alignment habits, tripod stability, and firmware maturity are treated as background era effects rather than ranked as science predictors.
M13 and M12 are kept in the historic view even with sparse coverage because the community member's research report centers on M81, M101, M13, and M12.
Capture stack
| Rig | Tripod | Mount / head | Telescope |
|---|---|---|---|
| S30 Pro | Original Seestar S50 tripod | INNOREL F20 Fluid Head | ZWO Seestar S30 Pro |
| S50 | Sky-Watcher Star Adventurer Tripod (S20555) | Sky-Watcher pier extension + K&F CONCEPT 3-Way Geared Tripod Head | ZWO Seestar S50 |
| WiNG | Sky-Watcher EQ-AL55i Pro steel tripod | Sky-Watcher EQ-AL55i Pro | William Optics Zenithstar 61 II + FLAT 61A |
| WideSky | Sky-Watcher Star Adventurer Tripod (S20555) | Sky-Watcher Star Adventurer Latitude (S20530) + Sky-Watcher AZ-GTi (S21110) | Askar FMA135 |
| 5SE / D5300 | Celestron NexStar SE tripod with built-in wedge | Celestron NexStar+ GoTo mount | Celestron NexStar 5SE OTA |
| PiNG | Celestron NexStar SE tripod with built-in wedge | Celestron NexStar+ GoTo mount | Celestron C6 StarBright XLT 6-inch OTA |
| C50 | Compatible with either Sky-Watcher Star Adventurer Tripod (S20555) and Star Adventurer Latitude wedge or Celestron NexStar SE tripod/wedge | Sky-Watcher AZ-GTi (S21110) or Celestron NexStar+ GoTo mount | Celestron C6 StarBright XLT 6-inch OTA |
| F30 | Sky-Watcher EQ-AL55i Pro steel tripod | Sky-Watcher EQ-AL55i Pro | Askar FMA135 |
Controlled run
Integration efficiency
This is the controlled one-night slice: both telescopes ran the same four survey targets with 30-second sub-exposures. The larger historic analysis below stays separate, so this small experiment can be read directly target-by-target and scope-by-scope.
This is the most direct small-sample view: for a planned one-hour target, shorter blue-green bars or larger warm segments show where accepted integration fell behind elapsed time. Because the rows are paired by target and telescope, differences such as the S30 M81 drift/jitter spike can be inspected without the broader historic-era confounders.
Geometry check
With only eight controlled rows, this is still descriptive rather than a regression. It is useful because target altitude, drift, and telescope model are held in a much cleaner side-by-side pattern than the historic rows.
Historic weather signal
The compact telemetry strips above now show drift, jitter, SNR/min, filter, wind, dew spread, and modeled sky brightness for each controlled row. In the historic data, wind gust is statistically significant after the age control (p < 0.01, incremental R2=0.08, n=94).
Exploratory analysis
Longitudinal read
This is the longitudinal practice signal: older rows show higher elapsed loss, with a simple age-only R2 of 0.26 and about 8.9 percentage points more loss per 30 days older. It is not evidence of a single cause, but it does support the idea that polar-alignment habits, tripod setup, firmware, and overall capture rigor improved across the observation history.
Geometry raw view
The raw altitude view does not show a clean low-altitude penalty by itself. In the age-controlled screen, mean altitude adds only 0.002 incremental R2, so the controlled one-hour rows are better suited to isolating altitude from target choice and observing era.
Tracking raw view
Reported drift trends in the expected direction: higher drift generally aligns with more elapsed loss. It is suggestive rather than decisive in this slice (p = 0.060, n=90), while reported jitter is a stronger tracking signal in the one-predictor screen.
Age-adjusted screen
The one-at-a-time screen currently puts Device is Seestar S30 at the top after the age control, with incremental R2=0.08. Read these bars as triage signals: correlated predictors can trade credit, and sparse-field additions can shift the ordering.
Shapley-like view
This uses permutation importance as a practical Shapley-like read: the model keeps observation age as a control, then measures how much accuracy drops when each research feature is shuffled. Model R2 is 0.49 across 126 historic rows. 1 feature had no usable variation and was omitted.
The multivariate view is dominated by historic-session structure: Device is Seestar S30 and Modeled sky brightness carry the most model weight. Among the environment terms, Modeled sky brightness is the largest contributor, which is interesting but still entangled with target/device/session mix.
Lunar raw view
Moon separation has only 47 populated rows and leans in a weak, counterintuitive direction here: farther Moon-target separation aligns with more loss (p = 0.086). That makes it a useful control to keep, but not yet strong evidence of lunar impact on dropped frames.
Analysis read
These are small, one-predictor-at-a-time OLS screens. Each result controls for observation age, so the highlighted effects are not just older setup and firmware era showing through.
After age control, stronger gusts align with more elapsed loss. Incremental R2=0.08, standardized slope=0.29, p < 0.01, n=94.
Average wind speed also aligns with more elapsed loss. Incremental R2=0.04, standardized slope=0.22, p < 0.05, n=94.
Rows with more reported jitter tend to lose more frames. Incremental R2=0.05, standardized slope=0.22, p < 0.05, n=90.
The modeled sky-brightness term lands just above the 0.05 cutoff. Incremental R2=0, standardized slope=0.06, p = 0.560, n=91.
The moon-separation relationship is visible below, but it is not significant here. Incremental R2=0.06, standardized slope=0.25, p = 0.086, n=47.
End altitude carries a modest age-controlled signal. Incremental R2=0, standardized slope=0.02, p = 0.829, n=91.
The export is strongest for capture, target, and SNR fields, while moon and some tracking fields are thinner. That uneven coverage is why the contribution model reports imputed counts and why the controlled run is useful as a cleaner comparison.
Data table
The loss metric is a historic proxy: elapsed capacity minus captured subs, divided by elapsed capacity. The controlled experiment is shown separately as elapsed duration against accepted integration. The `Age days` column is retained as a regression control and as a longitudinal practice signal.
Data dictionary
date Calendar date assigned to the observation export row.
daysBeforeLatestObservation Derived control variable. Zero is the newest observation in this export; larger values are older sessions. Used in regressions as a control for learning, tripod, and firmware era effects.
targetName / catalogId Displayed subject and Messier identifier for the observation.
deviceModel / deviceCode Seestar telescope model, currently normalized to S30 or S50 for the table.
sessionStartTime / sessionEndTime UTC start and end timestamps exported by AstroGuide when available.
astronomicalDarkStartTime / astronomicalDawnTime Astronomical dark start and dawn timestamps exported for the observing site when available.
subCount Number of accepted sub-exposures recorded for the session.
subLengthSeconds Exposure duration for each sub, in seconds.
totalElapsedSeconds Wall-clock session duration between the exported session start and end timestamps.
totalIntegrationSeconds Captured subs multiplied by sub length. This is useful exposure time, not total elapsed time.
integrationEfficiency AstroGuide's exported integration efficiency for the session window.
elapsedCapacitySubs Derived estimate: floor(total elapsed seconds / sub length seconds).
droppedSubEstimate Derived estimate: elapsed capacity minus captured subs, floored at zero.
elapsedDropRate Derived historic loss proxy: dropped estimate / elapsed capacity. The controlled one-hour run is also shown directly as elapsed duration vs accepted integration.
startAltitudeDeg Target altitude at the beginning of the exported session window, in degrees.
endAltitudeDeg Target altitude at the end of the exported session window, in degrees.
meanAltitudeDeg Derived midpoint of start and end altitude.
altitudeSpanDeg Derived absolute altitude change across the session window.
fitsTargetRaDeg / fitsTargetDecDeg Target right ascension and declination from FITS/session metadata when available; catalog fallback is used for target declination in the research JSON.
reportedDriftRateArcsecPerMin AstroGuide frame-evaluation metric. It fits RA and Dec position trends over time, combines their slopes, and reports radial drift in arcseconds per minute.
reportedJitterRmsArcsec AstroGuide frame-evaluation metric. RMS residual movement around the fitted RA/Dec drift line, in arcseconds. It represents wobble after removing steady drift.
reportedDriftRatePxPerMin / reportedJitterRmsPx Same reported drift and jitter quantities converted to pixels using the session pixel scale.
observedDriftRateArcsecPerMin Optional deeper observed-drift analysis when source frames or derived analysis assets are available.
observedJitterRmsArcsec Optional observed-drift RMS residual movement from the deeper analysis path.
ircutOrLp Built-in filter mode reported by the session, such as IRCUT or LP.
additionalFilterUsed Boolean derived from the export's additional_filter_used flag.
additionalFilterName / filterLabel External/additional filter name when present; otherwise falls back to the built-in filter label.
startingFocusPosition / endingFocusPosition Focus motor position at the beginning and end of the session when exported.
stackedRSnr / stackedGSnr / stackedBSnr AstroGuide stacked-image analysis signal-to-noise ratio by RGB channel when available.
avgStackedSnr Derived mean of the available red, green, and blue stacked-image SNR values.
stacked*CoverageFraction / avgStackedCoverageFraction Fractional coverage for the stacked channel metric. Useful for detecting uneven edges or coverage loss.
cloudCoverPercentAvg Average cloud cover percentage across weather samples in the session window.
humidityPercentAvg Average humidity percentage across weather samples in the session window.
dewPointSpreadCAvg Average temperature minus dew point, in Celsius. Smaller values mean greater dew risk.
windSpeedKmhAvg / windGustKmhMax Average wind speed and maximum gust across session weather samples.
siteSkyBrightnessMagPerArcsec2 Estimated site sky brightness in magnitudes per square arcsecond when exported.
modeledSkyBrightnessMagPerArcsec2Avg Average modeled sky brightness in magnitudes per square arcsecond across the session window.
moonTargetSeparationDegAvg Average angular separation between the Moon and target, in degrees, when exported.
incrementalR2 How much additional variance the predictor explains after the age control is already in the model.
standardizedSlope Direction and relative size of the predictor effect after controlling for observation age.
pValue / significanceLabel Approximate OLS p-value for the predictor term in loss ~ observation age + predictor.
relativeShare Permutation-importance share from the multivariate ridge model. Each feature is shuffled while the age control and other features remain in place.
mseIncrease / r2Loss How much model error rises when that feature is scrambled. Larger values mean the fitted model relied more on that feature.
imputedCount Rows where the feature was missing and the model used the feature median. This keeps the contribution screen comparable across uneven historic coverage.
Reproducible analysis
The notebook is generated from the same research dataset used on this page, with the derived JSON embedded directly so it can run without a companion CSV. It documents the dropped-frame proxy, includes the controlled-run slice, rebuilds the summary and field-coverage tables, charts SNR and sky-condition checks, and reproduces the age-controlled predictor and feature-contribution screens.
The notebook supports alternate regression checks alongside the page charts. It keeps
daysBeforeLatestObservation as a control term, which helps separate observing-era effects from the
science predictors under inspection.